Tidy Data Tutor helps you visualize data analysis pipelines
Tidy Data Tutor lets you write R and Tidyverse code in your browser and see how your data frame changes at each step of a data analysis pipeline. (If you use Python, check out Pandas Tutor.)
Why use this tool? Let's say you're trying to explain what this code does:
library(dplyr)
library(palmerpenguins)
penguins %>%
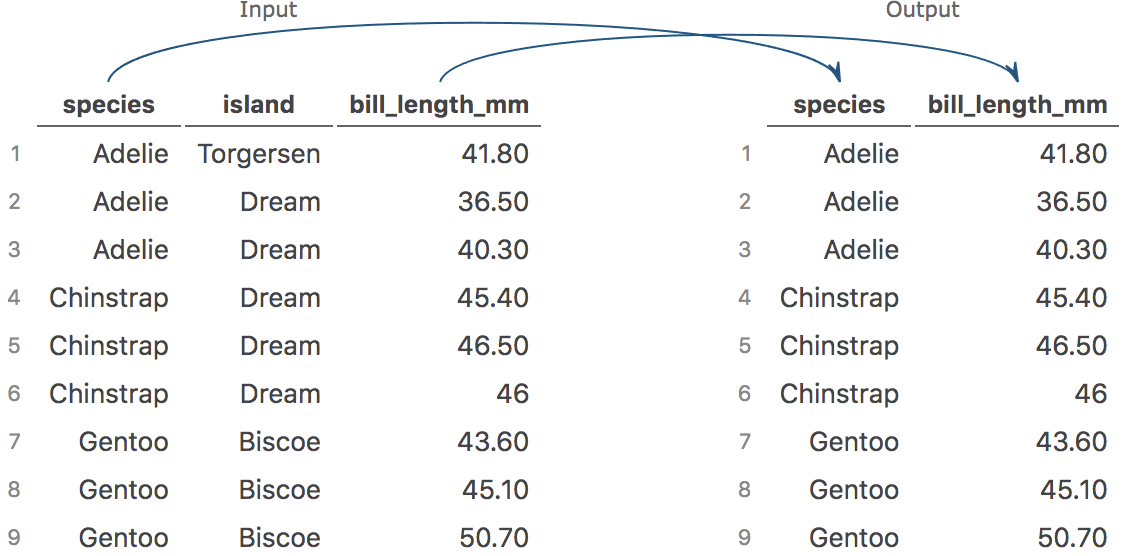
select(species, bill_length_mm) %>%
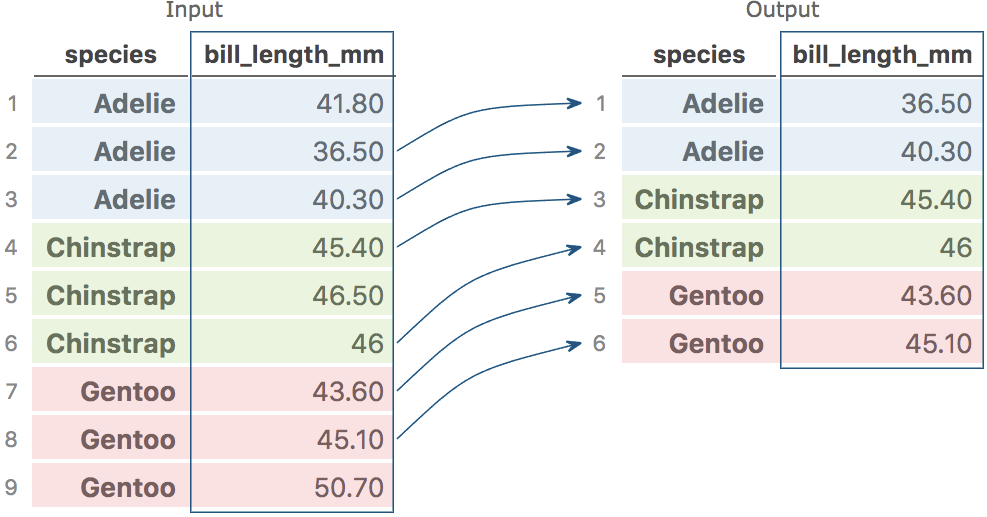
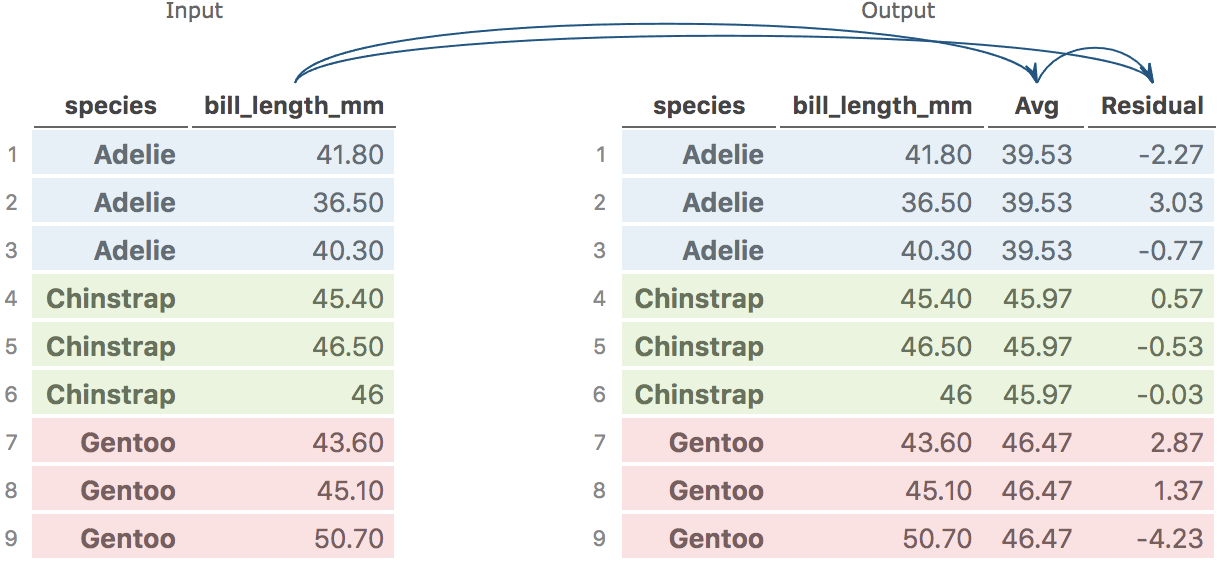
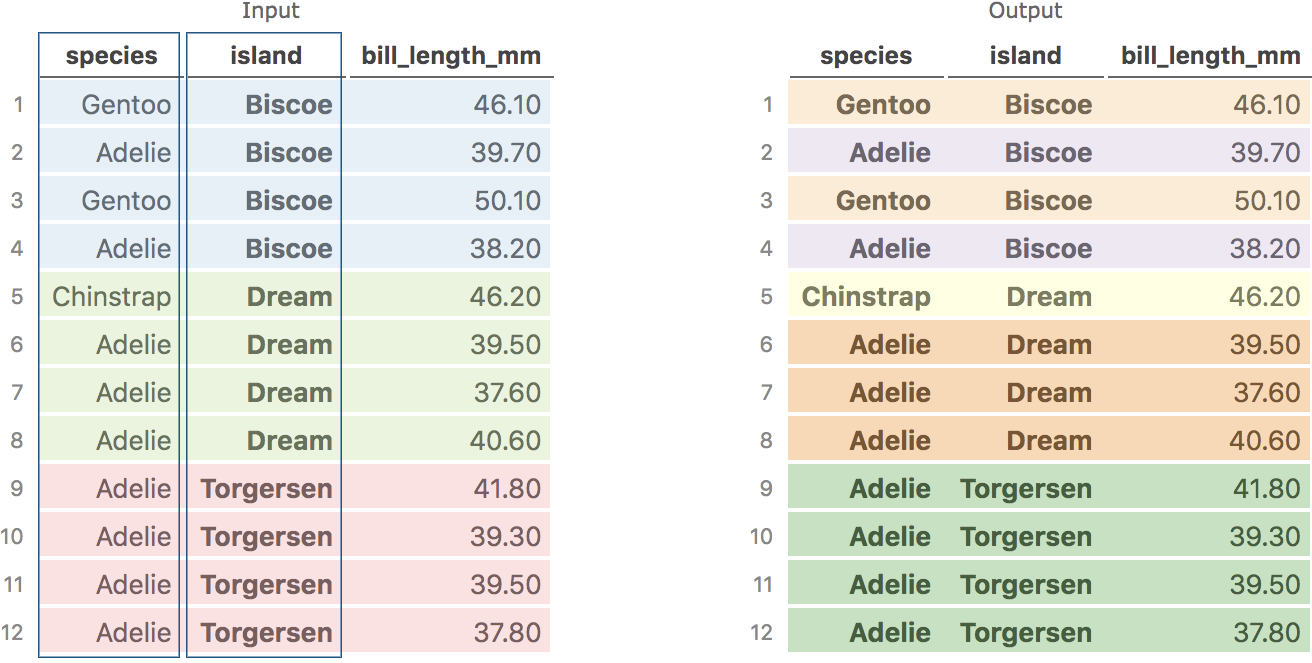
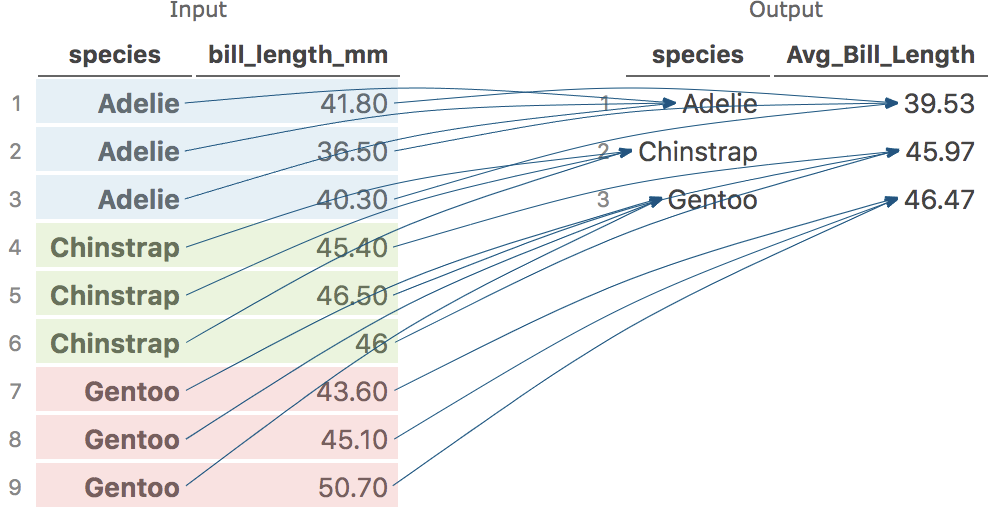
group_by(species) %>%
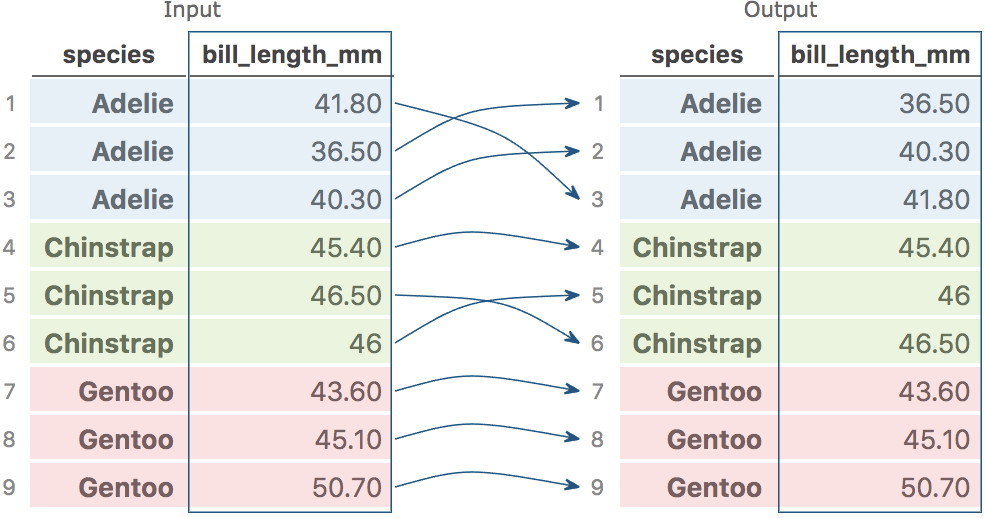
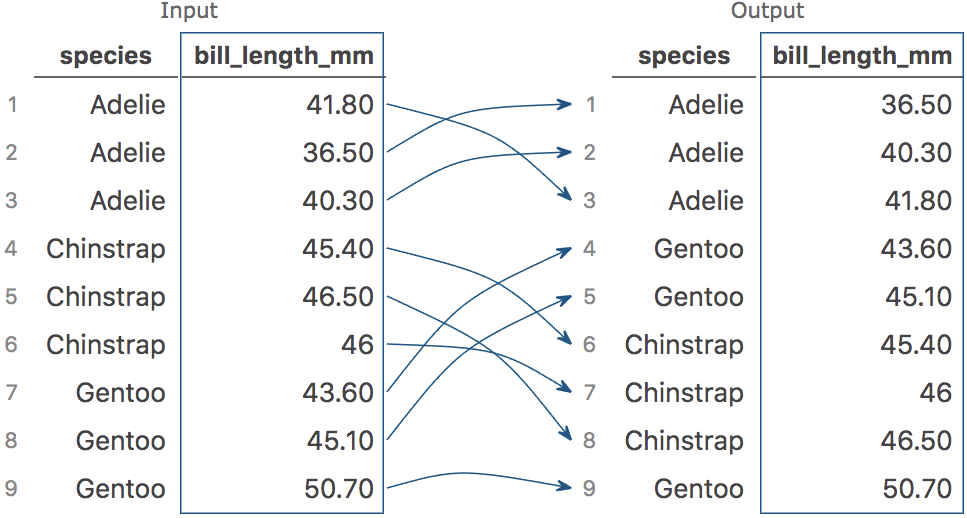
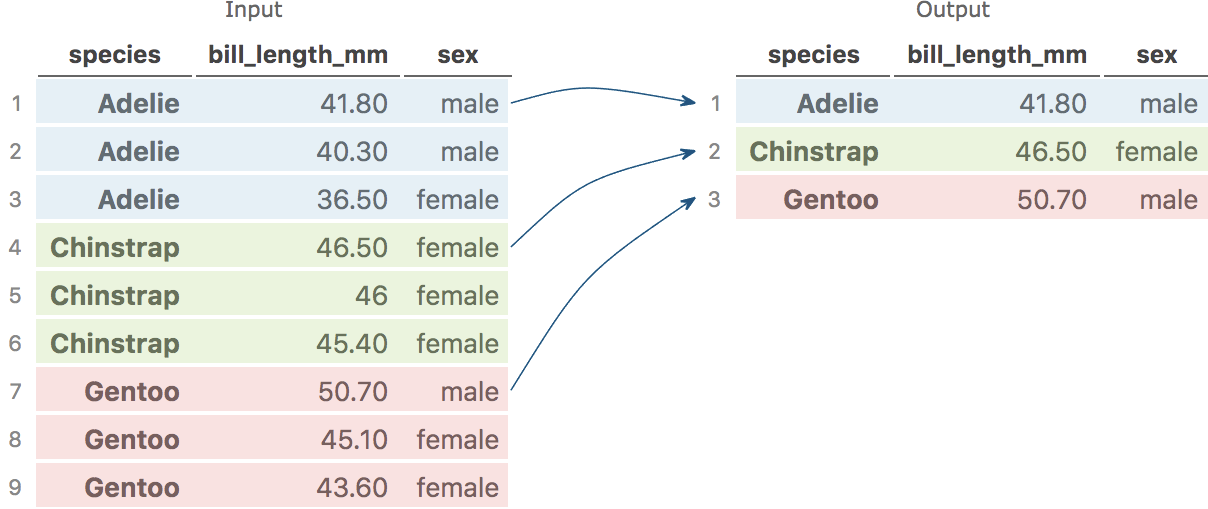
arrange(desc(bill_length_mm), .by_group = TRUE) %>%
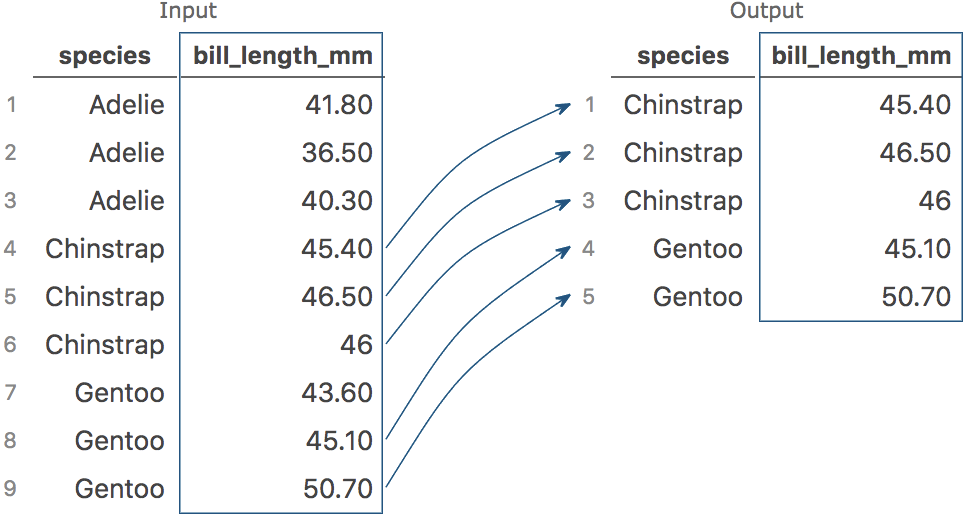
slice(1)
Running this code in R or RStudio shows only the final result:
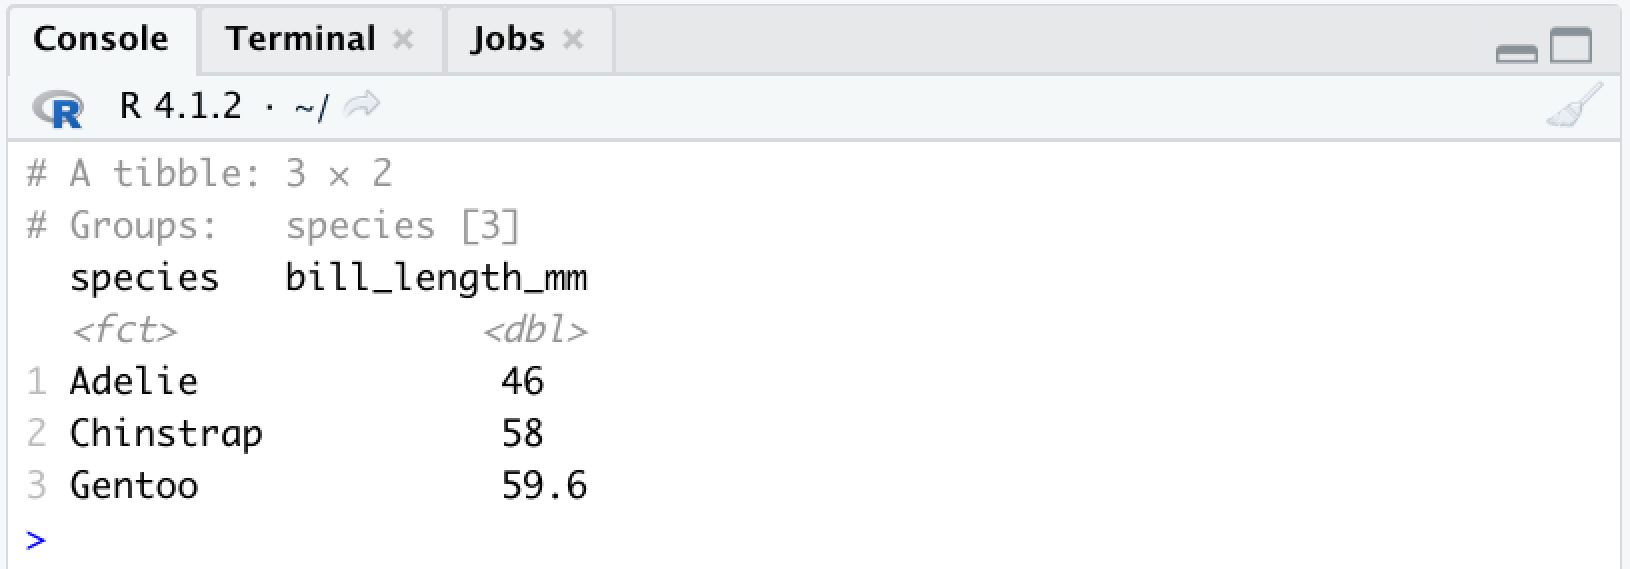
If you want to explain what's going on here, at least three things get in the way:
- Only the final data frame is shown, but this single pipeline involves 5 data frames.
- Almost none of the hundreds of rows in your input data made it to the end result.
- You can't see how data flowed through the pipeline to form groups and produce those 3 numbers.
If you ran this same code in Tidy Data Tutor, you can teach students exactly what's happening step-by-step:
Or if you're a student, you can use this tool to explore and learn on your own. Check out more examples below: